
In December 2003, the U.S. census bureau released data for the first time on the Arab population of the United States. The data is from the 2000 census. For information on the Jewish population, see Demographics. The census does not break down the figures by religion, but the Arab-American Institute estimates that about 77% of Arab-Americans are Christians (42% Catholic, 23% Orthodox, 12% Protestant) and 23% Muslim.
The Arab population in the United states was approximately 850,000 in 1990, 1,200,000 in 2000, 1,500,000 in 2010, and an estimated 1,800,000 in 2015 (making up 0.1% of the U.S. population).
In September 2023, the U.S. Census Bureau released detailed population counts from the 2020 census for individual Middle Eastern and North African identities. The census did not include an Arab checkbox, but respondents could write in identities such as Lebanese, Egyptian, Syrian, or Arab when answering the race question. This made it possible to identify individual Arab-origin populations. However, the Census Bureau did not publish a single Arab-only total directly comparable to the ancestry figures from earlier censuses.
The Census Bureau instead grouped these identities within a broader Middle Eastern and North African (MENA) classification that also includes non-Arab populations such as Iranians, Israelis, Kurds, Assyrians, and Yazidis. To maintain the narrower subject of this entry, the broader MENA totals are not used as substitutes for Arab population figures.
Arab Population
(2015 Estimate)
| Alabama | 10,757 |
| Alaska | 1,161 |
| Arizona | 34,091 |
| Arkansas | 5,466 |
| California | 287,543 |
| Colorado | 20,800 |
| Connecticut | 22,999 |
| Delaware | 3,127 |
| District Of Columbia | 4,489 |
| Florida | 112,700 |
| Georgia | 30,206 |
| Hawaii | 2,509 |
| Idaho | 3,198 |
| Illinois | 93,344 |
| Indiana | 18,429 |
| Iowa | 8,460 |
| Kansas | 9,805 |
| Kentucky | 14,275 |
| Louisiana | 18,050 |
| Maine | 4,655 |
| Maryland | 28,011 |
| Massachusetts | 73,044 |
| Michigan | 174,594 |
| Minnesota | 21,393 |
| Mississippi | 5,903 |
| Missouri | 19,826 |
| Montana | 1,664 |
| Nebraska | 7,881 |
| Nevada | 13,515 |
| New Hampshire | 9,291 |
| New Jersey | 99,604 |
| New Mexico | 4,972 |
| New York | 161,092 |
| North Carolina | 35,327 |
| North Dakota | 1,406 |
| Ohio | 79,837 |
| Oklahoma | 12,040 |
| Oregon | 16,240 |
| Pennsylvania | 64,070 |
| Rhode Island | 9,062 |
| South Carolina | 11,249 |
| South Dakota | 1,653 |
| Tennessee | 32,833 |
| Texas | 113,432 |
| Utah | 6,970 |
| Vermont | 2,755 |
| Virginia | 70,424 |
| Washington | 26,780 |
| West Virginia | 6,808 |
| Wisconsin | 13,714 |
| Wyoming | 652 |
| Total | 1,832,106 |
No equivalent Arab-only state table was published from the 2020 census. The Census Bureau’s available aggregate state figures cover the broader MENA population and include non-Arab groups. The 2015 Arab-ancestry estimates are therefore retained rather than replaced with MENA figures.
Arab Population by Selected Detailed Responses: 2020 Census
| Algerian | 30,439 | 38,186 |
| Arab or Arabic | 170,437 | 238,921 |
| Bahraini | 673 | 973 |
| Egyptian | 313,720 | 396,854 |
| Emirati | 1,931 | 2,480 |
| Iraqi | 179,252 | 212,875 |
| Jordanian | 102,919 | 121,917 |
| Kuwaiti | 5,204 | 6,923 |
| Lebanese | 328,137 | 685,672 |
| Libyan | 10,895 | 13,681 |
| Moroccan | 98,838 | 147,528 |
| Omani | 868 | 1,336 |
| Palestinian | 132,935 | 174,887 |
| Qatari | 452 | 650 |
| Saudi | 22,404 | 30,563 |
| Syrian | 122,194 | 222,196 |
| Tunisian | 10,667 | 15,270 |
| Yemeni | 73,692 | 91,288 |
The “alone” count represents people who reported only one detailed identity. The “alone or in any combination” count also includes people who reported that identity together with another racial or ethnic response. The figures should not be added to produce an Arab population total because respondents could report more than one detailed identity and because the Census Bureau applied privacy-protection noise separately to each published count.
The table excludes Iranian, Israeli, Kurdish, Yazidi, Berber, Assyrian, Chaldean, Syriac, and “Other Middle Eastern and North African” responses to preserve the narrower Arab definition.
Arab Population by Selected Ancestry Groups
(2019 Estimate)
Total | % of Arab Pop | |
| Egyptian | 279,672 | 13% |
| Iraqi | 176,737 | 8% |
| Jordanian | 93,085 | 4% |
| Lebanese | 481,758 | 23% |
| Moroccan | 118,125 | 6% |
| Palestinian | 139,398 | 7% |
| Syrian | 179,248 | 9% |
| Total | 2,097,642 |
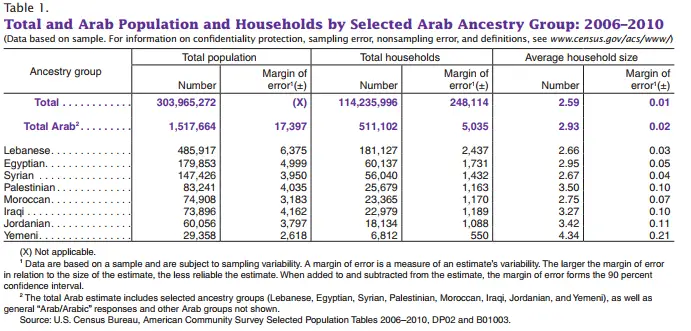
A survey by the U.S. Census Bureau titled “Arab Households in the United States 2006-2010,” published in May 2013, offers a overview of the Arab population in the United States. Data from the survey can be found below, to read the full survey please click here.
Arab Population by Selected Ancestry Groups: 2006-2010
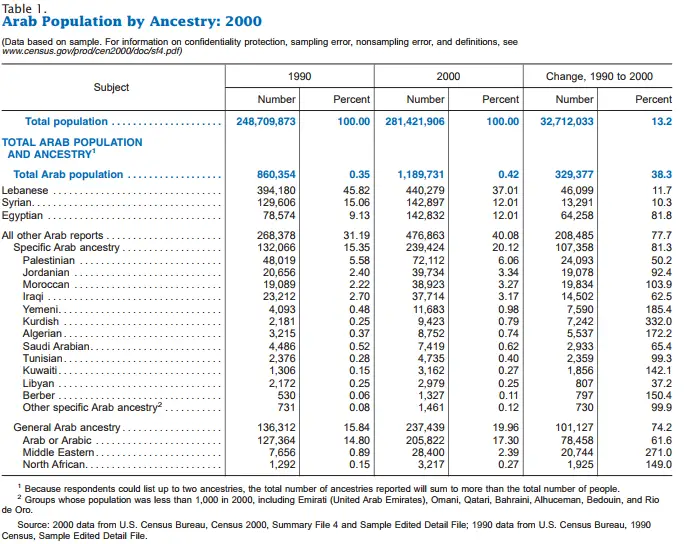
In 2000, 1.2 million people reported an Arab ancestry in the United States, up from 610,000 in 1980 (when data on ancestry were first collected in the decennial census) and 860,000 in 1990. The Arab population increased over the last two decades: 41 percent in the 1980s and 38 percent in the 1990s. Arabs represented 0.42 percent of the U.S. population in 2000, compared with 0.27 percent in 1980.
The 2022 American Community Survey estimated that approximately 2.2 million people reported Arab ancestry. Following the release of the detailed 2020 census data, the Arab American Institute calculated that the census had identified approximately 2.6 million Arab Americans. The institute said the figure could rise to approximately 2.8 million if the broader and ambiguous “Other Middle Eastern and North African” category were included. Because this entry uses the narrower Arab definition, the 2.6 million estimate is used here. The institute separately estimates that the actual Arab American population is at least 3.7 million after accounting for undercounting, immigration, and natural population growth.
The 2020 census continued to identify Lebanese as the largest detailed Arab-origin response, with 685,672 people identifying as Lebanese alone or in any combination. It was followed by Egyptian (396,854), Arab or Arabic (238,921), Syrian (222,196), Iraqi (212,875), Palestinian (174,887), Moroccan (147,528), Jordanian (121,917), and Yemeni (91,288). Unlike the earlier figures, however, these counts came from responses to the race question rather than the ancestry question and should therefore be compared with caution.
Arab Population by Ancestry: 2000
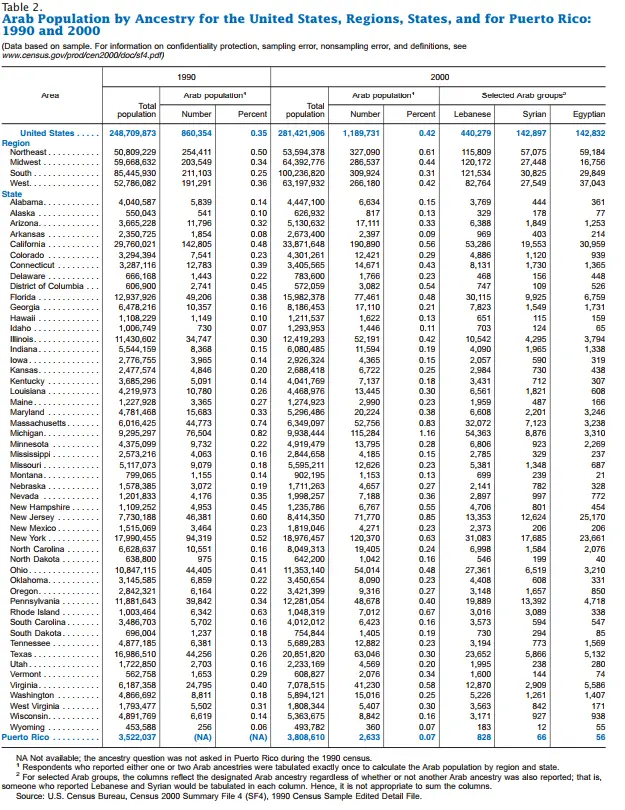
About half of the Arab population was concentrated in only five states: California, Florida, Michigan, New Jersey, and New York. These states contained 31 percent of the total U.S. population. People reporting an Arab ancestry also numbered over 40,000 in five other states (Illinois, Massachusetts, Ohio, Pennsylvania, and Texas). Over the last decade, the Arab population increased in almost every state. The Arab population in California increased by 48,000, more than in any other state.
The proportion of the population that was Arab was highest in Michigan where Arabs accounted for 1.2 percent of the total. Arabs comprised nearly 1 percent of the state populations in New Jersey and Massachusetts, which were 0.9 percent and 0.8 percent Arab, respectively.
Arabs represented a higher proportion of the population in 2000 than they did in 1990 in a large majority of states. The proportion of the population that was Arab grew from 0.8 percent in 1990 to 1.2 percent in 2000 in Michigan, and from 0.6 percent to 0.9 percent in New Jersey.
The 2020 Detailed DHC-A did not provide an Arab-only aggregate for states. Although it published state counts for individual identities such as Lebanese, Egyptian, and Palestinian, the Census Bureau cautioned against adding detailed populations to create custom totals because doing so accumulates statistical noise. An updated Arab-only state ranking is therefore not included.
Arab Population by Ancestry for the United States, Regions, States, and for Puerto Rico: 1990 and 2000
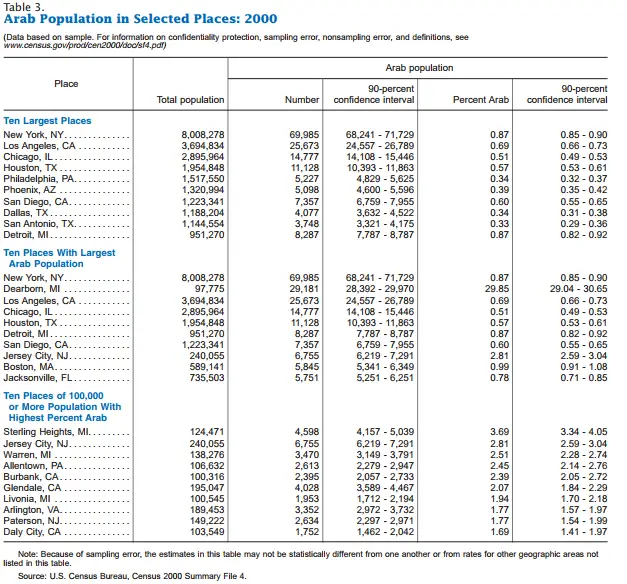
The largest number of Arabs lived in New York City. In 2000, 70,000 people of Arab ancestry lived in New York, making it the city with the largest number of Arabs. Six of the ten largest cities in the United States were also among the ten places with the largest Arab populations (New York, Los Angeles, Chicago, Houston, Detroit, and San Diego.
Arab Population in Selected Places: 2000
The 2020 census did not publish Arab-only aggregate totals for cities or other places. The available geographic totals combine Arab and non-Arab MENA populations and therefore are not used to update this section.
Source: U.S. Census Bureau.
Rachel Marks, Paul Jacobs, and Alli Coritz, “Lebanese, Iranian and Egyptian Populations Represented Nearly Half of the MENA Population in 2020 Census,” U.S. Census Bureau, (September 21, 2023).
“2020 Census Detailed Demographic and Housing Characteristics File A,” U.S. Census Bureau, (September 21, 2023).
“Arab American Institute Welcomes Inclusion of Arab American and MENA Data in Census Bureau’s Detailed DHC-A Release,” Arab American Institute, (September 21, 2023).“Arab American Heritage Month: April 2024,” U.S. Census Bureau, (March 18, 2024).